Running a business is a lot like driving a car, you need a dashboard to understand how things are going. Without it, you’re just guessing whether you’re heading in the right direction. For business owners, that dashboard is often a Profit and Loss Statement (P&L), also called an Income Statement.
This guide will walk you through how to create, read, and analyze a P&L statement, step by step. Whether you’re a founder trying to understand your numbers, a freelancer managing cash flow, or a small business owner preparing for growth, this article will help you confidently handle your financial statements.
What Is a Profit and Loss (P&L) Statement?
A Profit and Loss Statement shows your business’s revenues, costs, and expenses over a specific period, monthly, quarterly, or annually. In simple terms, it tells you if your business made money or lost money.
Think of it as a report card for your business’s profitability.
A standard P&L statement includes:
- Revenue (Sales/Income) – Money coming in.
- Cost of Goods Sold (COGS) – Direct costs of producing goods/services.
- Gross Profit – Revenue minus COGS.
- Operating Expenses – Marketing, payroll, rent, utilities, etc.
- Operating Profit (EBIT) – Earnings before interest and taxes.
- Other Income/Expenses – Loan payments, taxes, etc.
- Net Profit (Bottom Line) – The final profit or loss.
If your Net Profit is positive, you’re in the green. If negative, you’re losing money.
Why a P&L Statement Matters for Your Business
Your P&L isn’t just for accountants or tax season, it’s a powerful decision-making tool. Here’s why it matters:
- Financial Health Check – Quickly see if you’re profitable.
- Investor/Loan Requirement – Banks and investors often ask for it.
- Goal Tracking – Helps you measure growth against targets.
- Expense Management – Spot areas where you’re overspending.
- Forecasting – Use historical data to predict future profits.
Without reviewing your P&L regularly, you’re running your business blind.
How to Create a Profit and Loss Statement
You don’t need to be a CPA to put together a P&L. Here’s a beginner-friendly process:
Step 1: Choose a Time Period
Decide whether you want a monthly, quarterly, or annual P&L. Monthly gives you more detailed tracking; annual is often required for taxes.
Step 2: Collect Revenue Data
List all sources of income:
- Product sales
- Service income
- Subscriptions
- Any other operating revenue
Step 3: Calculate COGS (Cost of Goods Sold)
These are direct costs related to producing your product/service:
- Materials
- Labor tied directly to production
- Manufacturing costs
Formula:
COGS = Beginning Inventory + Purchases – Ending Inventory
Step 4: Subtract COGS from Revenue
This gives you Gross Profit.
Gross Profit = Revenue – COGS
Step 5: List Operating Expenses
Examples include:
- Salaries & Wages
- Rent
- Marketing/Advertising
- Utilities
- Insurance
- Depreciation
Step 6: Calculate Operating Income
Operating Income = Gross Profit – Operating Expenses
Step 7: Add Other Income/Expenses
This may include:
- Loan interest
- Taxes
- One-time income or expenses
Step 8: Get Net Profit
Finally:
Net Profit = Operating Income – Other Expenses + Other Income
That’s your bottom line.
Read More: What Is a Profit and Loss Statement
Example of a P&L Statement (Simple Format)
Here’s a monthly P&L statement example for a small business:
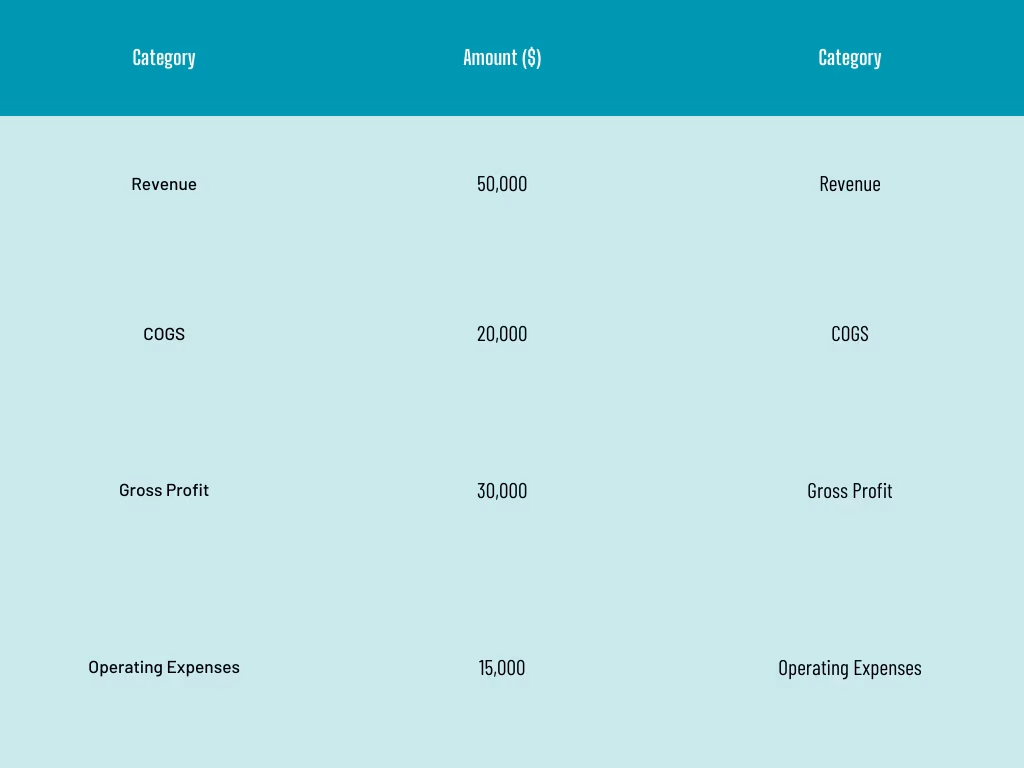
This business made $10,000 net profit for the month.
How to Read and Analyze a Profit and Loss Statement
Creating a P&L is just half the job, the real value comes from analysis.
Here’s what to look for in your P&L review:
1. Revenue Trends
- Are sales growing month-over-month?
- Do you see seasonal fluctuations?
- Which products/services bring in the most revenue?
2. Gross Profit Margin
Formula: (Gross Profit ÷ Revenue) × 100
- A higher margin = more efficiency.
- Compare against industry benchmarks.
3. Expense Ratios
Break expenses into categories:
- Marketing as % of revenue
- Payroll as % of revenue
- Rent as % of revenue
If one category is unusually high, it may be eating into profits.
4. Operating Profit (EBIT)
This shows your core business performance without taxes or loans factored in.
5. Net Profit Margin
Formula: (Net Profit ÷ Revenue) × 100
- This tells you how much profit you keep from every $1 earned.
6. Year-over-Year Comparison
Compare your current P&L with last year’s:
- Are revenues up?
- Are expenses growing faster than income?
- Is profitability improving?
Key Ratios for Profit and Loss Analysis
Here are a few must-know ratios:
- Gross Margin = (Revenue – COGS) ÷ Revenue
- Operating Margin = Operating Income ÷ Revenue
- Net Margin = Net Profit ÷ Revenue
- Expense Ratio = Expense ÷ Revenue
These ratios help you quickly spot strengths and weaknesses.
Common Mistakes in P&L Analysis
Even seasoned business owners trip up on these:
- Ignoring small expenses – Coffee for the office adds up!
- Not separating personal & business finances
- Focusing only on revenue – Profit matters more.
- Not updating regularly – A yearly P&L is too late for corrections.
- Failing to benchmark – Always compare against industry standards.
Tools to Simplify P&L Analysis
You don’t need to do this on spreadsheets forever. Some tools:
- QuickBooks – Automated P&L creation
- Xero – User-friendly interface for small businesses
- FreshBooks – Great for freelancers
- Otto AI – Use AI-powered accounting insights for real-time analysis
Story: How a P&L Saved a Small Business
Meet Lena, a café owner in Miami. She thought her café was profitable because revenue was steady at $25,000/month. But when she finally reviewed her P&L statement, she discovered:
- COGS had crept up due to supplier costs
- Marketing expenses were 20% of revenue, too high
- Net Profit was only $1,200/month
By cutting marketing overspend and renegotiating supplier rates, she boosted her Net Profit to $4,000/month.
Lesson: Without analyzing her P&L, Lena would have never realized where money was leaking.
How to Use Your P&L for Business Growth
Your P&L isn’t just a compliance document. It’s a growth tool.
- Use it to set profit goals.
- Adjust expenses based on ratios.
- Attract investors with a strong profitability story.
- Improve tax planning.
Conclusion
A Profit and Loss Statement may sound intimidating, but once you break it down, it’s simply a map of your business’s money flow.
By learning how to create and analyze a P&L, you’ll:
- Understand where your money goes
- Spot hidden profit leaks
- Make smarter financial decisions
So, next time you sit down with your numbers, don’t just look at revenue, dive deep into your P&L review. It might just reveal the insights that take your business to the next level.